01Case Study Flow
02Introduction
We went to where farmers actually use the app: in the field, in the heat, under pressure. Over five days, it became obvious that our neat flows didn’t match their reality, and that every wrong assumption about navigation, readability, or trust showed up as a support call or a missed action on the farm.
Introduction
Five Days in Anantapur
Over a span of five days in Anantapur, Andhra Pradesh, we engaged with at least two farmers daily to understand our users better & identify issues farmers are facing with our app.
This initiative was spearheaded by the Product Team, with support from the Customer Success and Agri Research Teams.
Location
Why Anantapur?
Anantapur was chosen for its concentration of large and influential farmers, despite the presence of Fasal devices nationwide.
Company
Fasal.co
Fasal is helping farmers improve practices via an IoT device connected to an app available on Android & iOS.
03Research Goals
We wanted to understand how farmers actually use the app, not how we assumed they did. What features do they rely on? What trips them up? What would make their day easier? These questions shaped everything we asked on the ground.
Research Objectives
Key Areas of Inquiry
To understand the adoption of our application and the factors that influence it in farmers everyday routines.
To understand the issues faced by farmers with our application or hardware.
To understand farmers expectations and pain points in terms of features and services.
To understand farmers' intent for using the application and correlate it with existing product features.
To understand the depth of farmers understanding & awareness of product features that they value or have strong intent towards.
- a. Identify pain points impacting user experience.
- b. Identify reasons for such pain points, such as farmers' technical competency, the product's learning curve or intuitiveness.
04Insights to gather during the visit
Beyond the formal goals, we stayed alert for the things farmers rarely say out loud: where they hesitate before tapping, who they call when they’re unsure, and what they trust more, the app, a call from support, or advice from the shop.
Observational Goals
Key Insights to Gather
Collect qualitative feedback on the issues faced by farmers.
Understand farmers mental models towards different everyday applications.
Assess farmers' tech literacy and general literacy about other languages and practices in farming.
Determine how farmers learn about new things in the market or in general.
Gauge farmers' willingness to update their farming information on our app.
Estimate the preparation time needed for action items.
Evaluate the impact on the product's UX.
05Selection of Farmers & Script Writing
To avoid hearing from the "usual suspects" only, we worked with the Customer Success Team to pull a spread of segments so we could hear from farmers at every level of experience and literacy, and from that pool we selected 10 farmers.
We wrote the interview script before heading out: open-ended prompts designed to get farmers talking, not just answering yes or no.
Field Visit
The Conversation Script
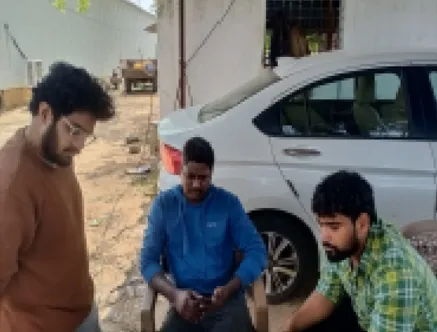 On-site Interview
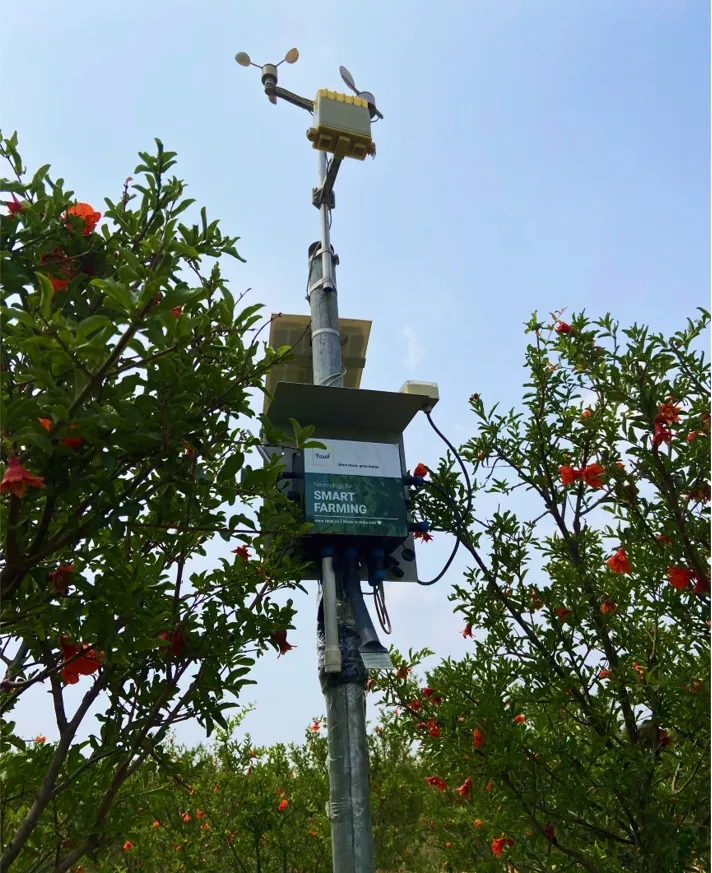 Fasal Device
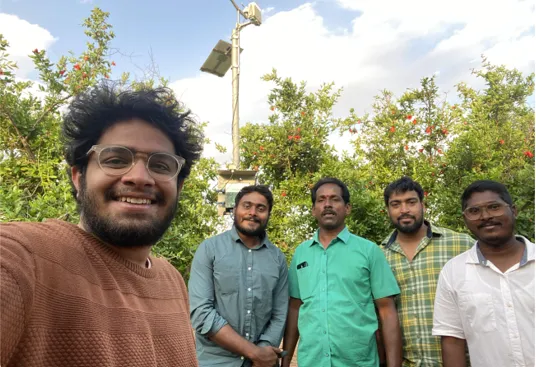 Selfie with FarmerOn-site InterviewFasal DeviceSelfie with Farmer
06Observations from farmer interviews
We met each farmer individually, had them use the app live, and talked through the everyday challenges they face. Some navigated straight to soil moisture; others never scrolled beyond the first card.
The goal was to see the app through their eyes, not ours, including the moments where they ignored our back button and tried to use the phone’s hardware back instead.
Chandra Shekar Reddy
Pomegranate Farmer
Reddy Uses
Field Notes & Observations
Chandra Shekar ReddyP.S. It started raining. Some farmers sent us home with mangoes, guavas, and oranges.
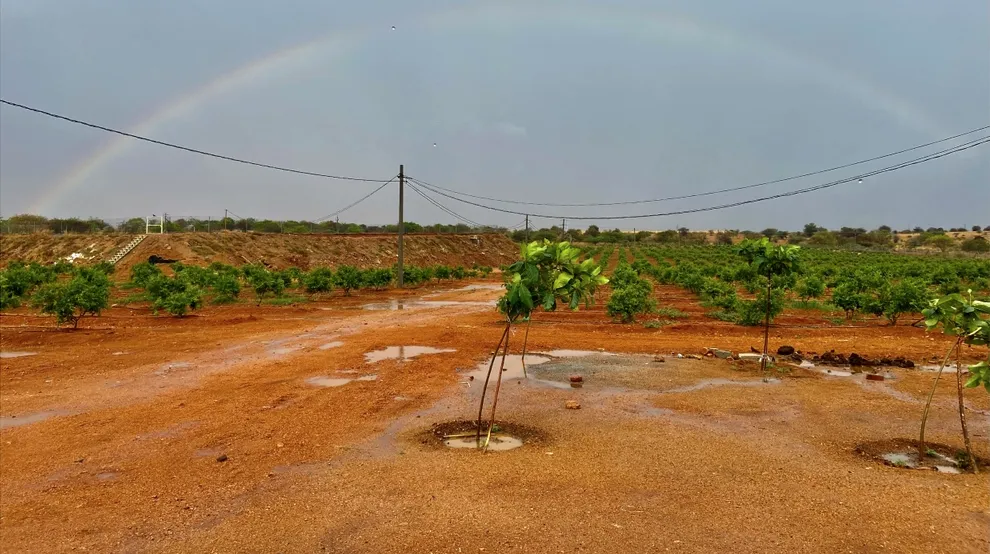 Field Setup
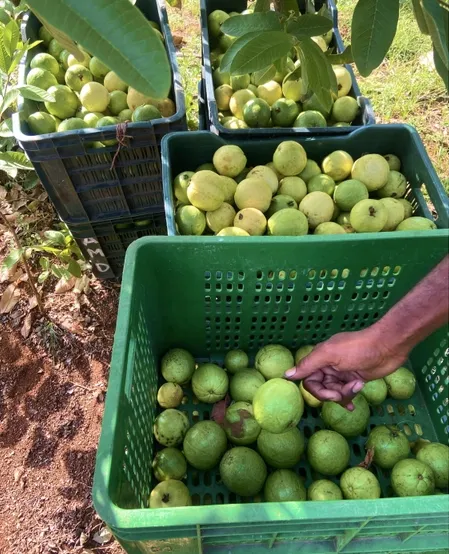 Harvest Sorting
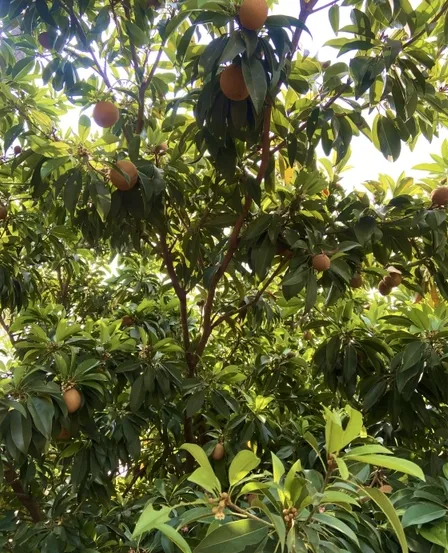 Orchard SurveyField SetupHarvest SortingOrchard Survey
07Card sorting : Common Observation
We grouped recurring observations to find the patterns: the themes that kept surfacing across different farmers and different days.
Users are using our application on regular basis, Average usage time is 10min a day.
Farmers are told that our devices only useful for water management and so the market got biased towards it.
Everybody was keen on understanding pest and disease technical names. They were more inclined towards us showing trade names.
People were more keen on contacting the CS than raising a ticket as it is more person to person.
They had difficulty in understanding crop cycle stage wise segregation of activities as the stage name or ribbon was getting ignored.
Most of the farmers have great knowledge about POM Farming and we have observed compare & confirmation bias.
Their decision of pest and disease sprays from Fasal advisory are being manipulated by Local shop vendors.
Most of them were maintaining dairies for activities done farm and finances as that was more comfortable and easily accessible according to them.
Most of them were not using the menu but just the card that is visible on the home. Some of them use alerts but mostly the home.
Farmers were talking about innovation in farming like Robots, AI scanning for disease and pest.
Dosage suggestion was a common ask among all farmers.
Farmers had difficulty in using our back button, they were trying to use main navigation buttons and as a result app was closing.
Most of the farmers are following BT Gore and very keen to learn about new farming methods and how they can improve further.
Diifficulty in Understanding the technical terms we present on application.
Most of the farmers seemed to not have onboarding properly.
08Identified Themes and Possible Solutions
We ran brainstorming sessions using the 3 Whys method to pressure-test each issue. For every idea, we weighed potential impact against effort, the raw material that later fed into the RICE scores.
Unable to go back using our back button multiple times.
Tech : Fix back button issue. Phone back button is what users are accessing so it can be single click one step back, click twice show warning to exit the app?
Navigation towards going back would match users expectation hence improving experience and removing confusion.
Most of them were not using the menu but just the card that is visible on the home. Some of them use alerts but mostly the home.
Following a widget or dashboard like structure might help us position all the features upfront and accessible.
This will add feature visibility on the application and add quick access from one page to most of the features by decreasing the travel distance of finer and no of clicks. might help in clearing the bias when showcasing the features.
3 gauges present on home but more data is present and scattered across the page loosing context from the plot page.
Follow the same order as present on the plot card & Provide insight to the user about what they can expect after clicking on gauges section.
Follow the same order as present on the plot card & Provide insight to the user about what they can expect after clicking on gauges section.
Time taken to find activities, forecast from the data screen is around 15-20secs.
Using Iconography can improve the visibility of these tabs.
It will act as visual cues for the user to remember easily & reduce the time expenditure to find activities & forecast.
Contextual Clicks are absent
Provide insight to the user about what they can expect after clicking on gauges section. Follow the same order as present on the plot card.
This might provide value to the farmer by removing confusion and adding context to the user so that they wont feel lost and improve adoption on the app. - App usage time might be improved.
09Task prioritization : Rice framework
After aligning with PMs and Directors on the candidate solutions, we fed each theme into the RICE framework (reach, impact, confidence, effort) so the roadmap started with the highest-impact fixes for farmers, not the loudest opinions in the room.
10Conclusion
Five days in Anantapur changed how the team builds. Every assumption we brought in about navigation, data readability, and trust in the app was tested by a real farmer trying to use it. Those five days directly reshaped the navigation that farmers actually tap, simplified the data views they rely on, and led to a RICE-driven roadmap grounded in real field evidence.